Testing Integration
Testing Integration
Comprehensive testing support for .NET projects with test discovery, execution, debugging, and AI-powered test generation.
Overview
Section titled “Overview”C# Dev Tools provides complete testing integration:
- Test Discovery - xUnit, NUnit, MSTest, SpecFlow support
- Running Tests - All tests, specific projects, individual tests
- Debugging Tests - Full debugging support with breakpoints
- Test Filtering - Group and filter tests efficiently
- Code Coverage - Interactive coverage dashboard with risk analysis
- Test Generation - AI-powered test creation with GitHub Copilot
- SpecFlow Support - BDD testing integration
- Playwright Integration - End-to-end browser testing
Test Discovery
Section titled “Test Discovery”Tests are automatically discovered from:
- MSTest - Microsoft’s testing framework
- xUnit - Modern extensible framework
- NUnit - Feature-rich testing framework
- SpecFlow - BDD/Gherkin tests
Tests are organized hierarchically by:
- Project
- Namespace
- Test class
- Test method
Running Tests
Section titled “Running Tests”Running All Tests
Section titled “Running All Tests”Click the “Run All Tests” button in the Test Explorer title bar, or use Ctrl+R, T.
Running Specific Test Projects
Section titled “Running Specific Test Projects”Right-click on a test project in Solution Explorer and select “Run Tests”.
Running Individual Tests
Section titled “Running Individual Tests”- Hover over a test in Test Explorer
- Click the “Run Test” icon (play button)
Running Test Groups
Section titled “Running Test Groups”- Hover over a namespace or class
- Click the “Run Tests” icon
- All tests in that group execute
Debugging Tests
Section titled “Debugging Tests”To debug a test:
- Set breakpoints in your test code
- Hover over a test in Test Explorer
- Click the “Debug Test” icon (bug icon)
- The debugger stops at your breakpoints
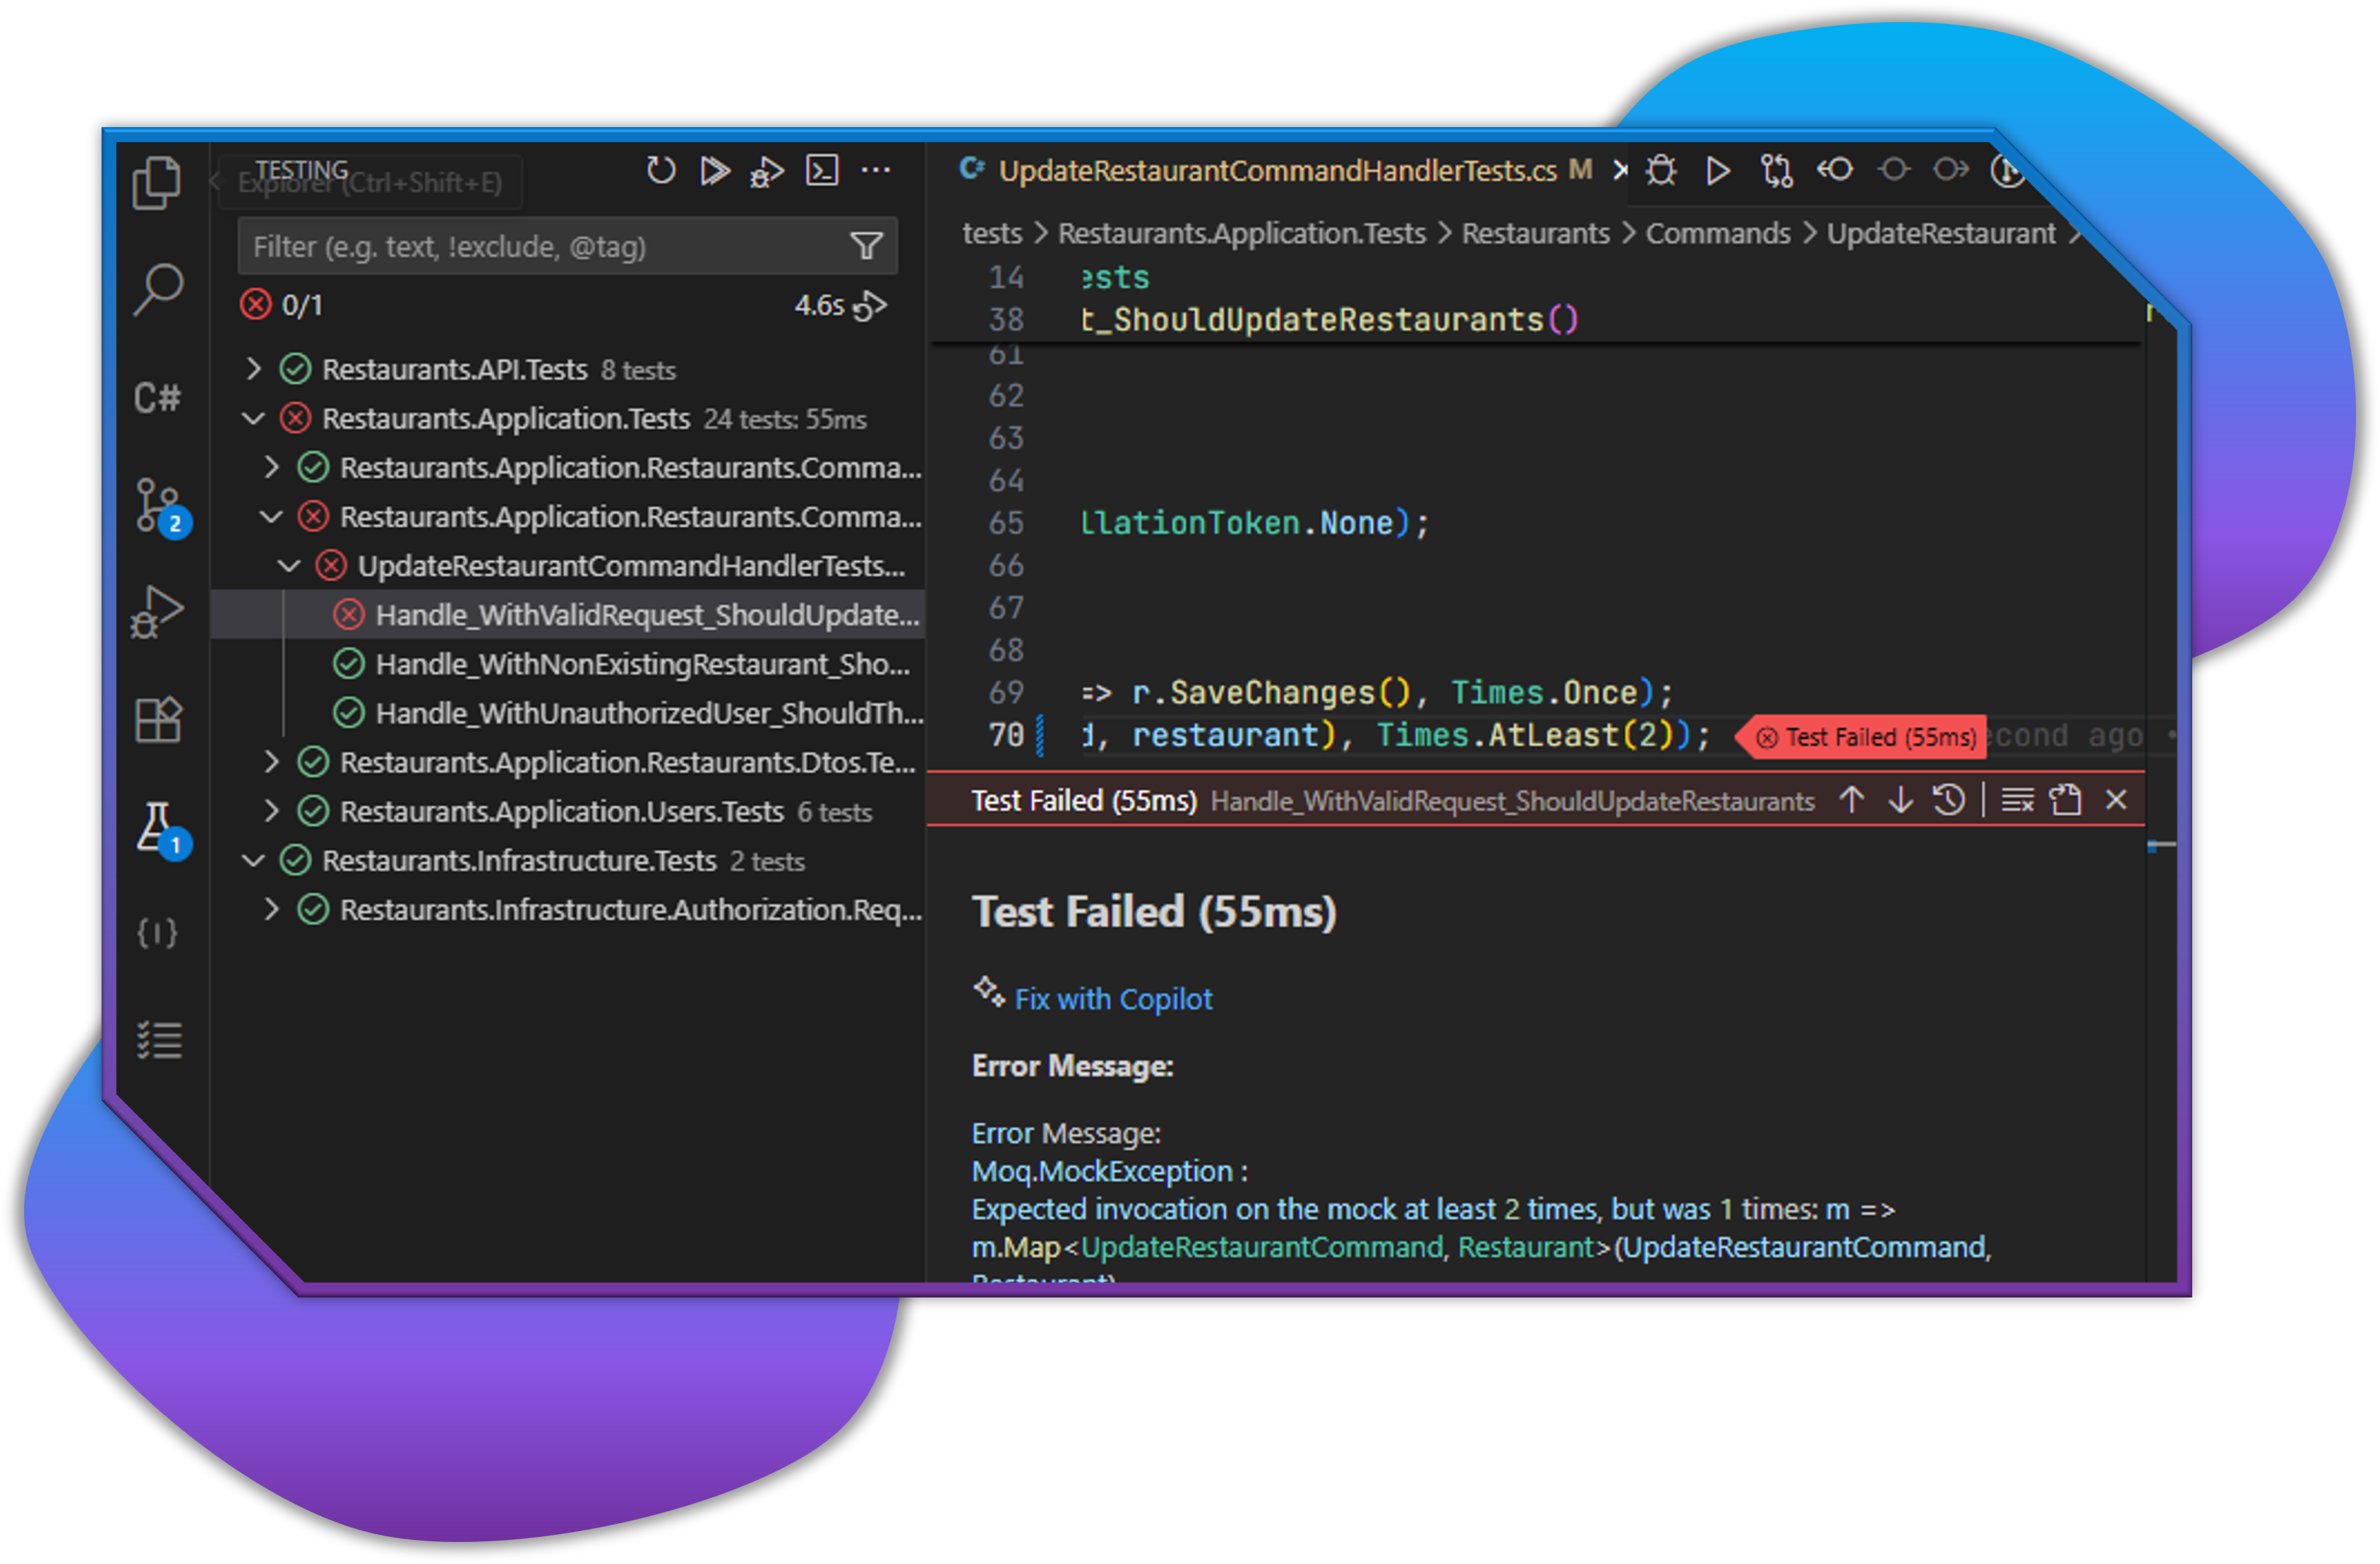
Test Results
Section titled “Test Results”After running tests:
- ✓ Green check: Passed
- ✗ Red X: Failed
- ⚠ Yellow triangle: Skipped
Click on a failed test to see:
- Error message
- Stack trace
- Expected vs actual values
- Source line
Test Filtering and Grouping
Section titled “Test Filtering and Grouping”Filter tests by:
- Name (using search box)
- Status (passed/failed/skipped)
- Project
- Class
Group tests by:
- Project
- Namespace
- Class
- Status
Test Output
Section titled “Test Output”View detailed test output:
- Run tests
- Open Output panel (
Ctrl+Shift+U) - Select ”.NET Test Log” from dropdown
- View execution logs
Accessing Test Explorer
Section titled “Accessing Test Explorer”- Click the Test Explorer icon (beaker) in Activity Bar
- Or use Command Palette: “Test: Focus on Test Explorer View”
- Or right-click a test project: “Run Tests”
Test Navigation
Section titled “Test Navigation”Navigate to test source:
- Click any test in Test Explorer
- The source file opens at the test method
- For failed tests, click stack trace lines to navigate
Test Settings
Section titled “Test Settings”Configure test behavior:
- Open VS Code settings (
Ctrl+,) - Search for “testing”
- Adjust:
- Auto-run on save
- Test Explorer view
- Discovery behavior
Integration with Solution Explorer
Section titled “Integration with Solution Explorer”Tests integrate seamlessly:
- Right-click test projects to run tests
- View test project dependencies
- Manage test NuGet packages
- Set test project configurations